- Selling
- Buying
- Landlords
- Renting
- New homes
- House prices
- International services
 International offices
China, Hong Kong SAR, India, Indonesia, Malaysia, Middle East, Qatar, Singapore, Thailand and Turkey
Learn more - News
- Contact
- About us
- My B&R


Have London homebuyers ended their Crossrail love affair already?
- Property market
- 27.10.23
- Benham & Reeves
 The latest research by London lettings and estate agent, Benham and Reeves, has revealed that the appeal of Crossrail amongst homebuyers could be diminishing, as no less than 20 Crossrail stations have seen the annual rate of house price growth within their respective postcodes trail that of the wider local authorities they are located within.
Benham and Reeves analysed current market values and the annual rate of growth across each postcode home to a Crossrail station and how their performance compares to the wider local authority in which they are located.
The research shows that topline Crossrail house prices have climbed by +2.4% over the last year, marginally higher than the +1.9% increase seen across the wider local authorities home to a Crossrail station.
The best performing Crossrail station over the last year has been Romford. Not only have house prices within the RM1 postcode increased by +14% year on year – the highest rate of growth of all stations – the postcode has also outperformed the wider borough of Havering by +9.6%.
Liverpool Street station has seen the second largest outright annual rate of house price growth at +12%, outperforming the wider City of London by +2.9%.
House prices surrounding the Forest Gate Crossrail station are up +9% year on year, the third highest annual rate of growth. At the same time, property values across the wider borough of Newham have cooled by -0.1%, meaning Forest Gate house prices have outperformed the wider borough by +9.1%.
Property values surrounding Farringdon station are up +6% versus a -2.6% drop across the borough of Islington; Maidenhead’s SL6 postcode has seen a +5% jump versus a -1.4% decline across Windsor and Maidenhead as a whole; and RM6, home to Chadwell Heath Crossrail station, is up +6% versus a -0.3% decline across the borough of Redbridge.
The other top 10 Crossrail stations to have posted a stronger performance when compared to the wider area in which they are located include Brentwood (+5.8%), West Drayton (+5.8%), West Ealing (+4%) and Hanwell (+3%).
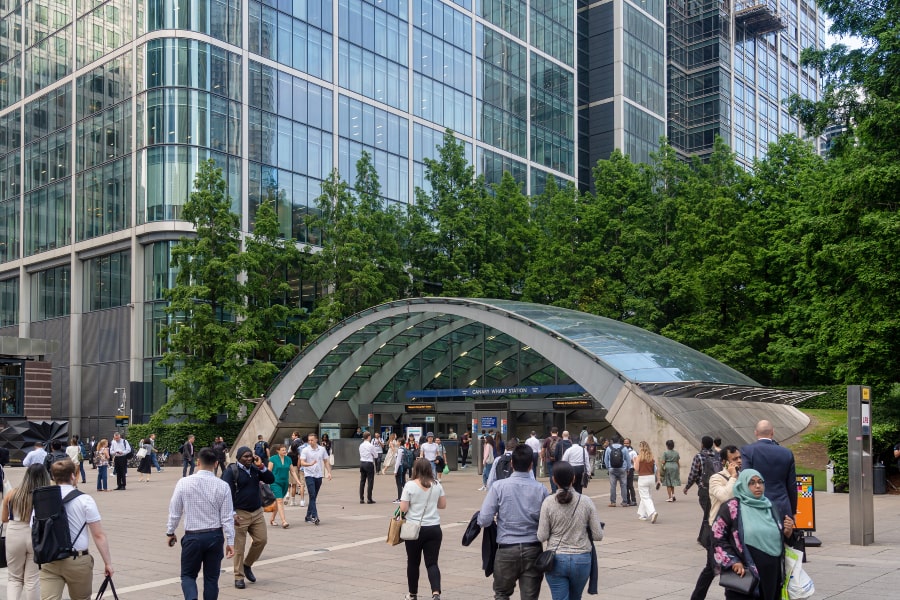
In contrast, house prices within the E14 postcode, home to the Canary Wharf Crossrail station, have fallen by -17% in the last year, while Whitechapel’s E1 postcode has seen a -1% reduction. As a result, both Crossrail stations trail the wider borough of Tower Hamlets where the average house price has increased by +10% annually.
Property values surrounding no less than 18 other Crossrail stations have also underperformed when compared to their wider local authorities – Gidea Park, Acton Main Line, Southall, Woolwich, Custom House, Twyford, Reading, Tottenham Court Road, Stratford, Maryland, Langley, Abbey Wood, Slough, Burnham, Goodmayes, Seven Kings, Manor Park and Harold Wood.
Director of Benham and Reeves, Marc von Grundherr, commented:
“Crossrail was so hotly anticipated for such a prolonged period of time that house prices rocketed across the line as homebuyers looked to secure a property within close proximity to the game changing transport link.
However, it’s fair to say that since launch the shine has perhaps faded across many pockets of the network now, as many Londoners realise that their existing transport routes remain the most convenient way to traverse the capital.
So although Crossrail property values as a whole are still standing fairly strong, there are as many as 20 stations where property values have trailed the wider area over the last year.
Canary Wharf has been the worst hit in this respect and with HSBC making the decision to relocate to the city, we expect demand from working professionals to fall further. House prices in Whitechapel’s E1 postcode have also trailed the wider borough of Tower Hamlets but, of course, the flipside to this underperformance is that it presents buyers and investors with a great opportunity to purchase.
We are currently seeing very strong demand for rental homes within the Whitechapel area and it currently ranks as one of our top five rental hotspots across the city. As a result, rental values are climbing and this is providing some extremely favourable yields.
As the saying goes, be fearful when others are greedy and greedy when others are fearful.”
| Table shows annual house price growth in postcodes home to a Crossrail station, the annual rate of house price growth across the wider local authority and how the two compare. Sorted by house price growth comparison | |||||||
|---|---|---|---|---|---|---|---|
| Crossrail Station | Crossrail Station Postcode | Postcode Average House Price | Postcode Annual Increase (%) | Wider Local Authority | Local Authority Average House Price | Local Authority Annual Increase (%) | Difference in Annual Growth (%) |
| Bond Street | W1 | £1,677,972 | -1.0% | City of Westminster | £891,532 | -13.3% | 12.3% |
| Romford | RM1 | £370,854 | 14.0% | Havering | £432,421 | 4.4% | 9.6% |
| Forest Gate | E7 | £483,386 | 9.0% | Newham | £395,101 | -0.1% | 9.1% |
| Farringdon | EC1 | £813,811 | 6.0% | Islington | £701,705 | -2.6% | 8.6% |
| Maidenhead | SL6 | £499,446 | 5.0% | Windsor and Maidenhead | £531,571 | -1.4% | 6.4% |
| Chadwell Heath | RM6 | £389,958 | 6.0% | Redbridge | £467,406 | -0.3% | 6.3% |
| Brentwood | CM14 | £394,839 | 8.0% | Brentwood | £478,973 | 2.2% | 5.8% |
| West Drayton | UB7 | £374,752 | 8.0% | Hillingdon | £454,705 | 2.2% | 5.8% |
| West Ealing | W13 | £673,694 | 9.0% | Ealing | £537,014 | 5.0% | 4.0% |
| Hanwell | W7 | £569,597 | 8.0% | Ealing | £537,014 | 5.0% | 3.0% |
| Iver | SL0 | £527,968 | 6.0% | Buckinghamshire | £469,040 | 3.1% | 2.9% |
| Liverpool Street | EC2 | £991,432 | 12.0% | City of London | £885,581 | 9.1% | 2.9% |
| Hayes and Harlington | UB3 | £397,400 | 5.0% | Hillingdon | £454,705 | 2.2% | 2.8% |
| Taplow | SL6 | £499,446 | 5.0% | Buckinghamshire | £469,040 | 3.1% | 1.9% |
| Shenfield | CM15 | £527,344 | 4.0% | Brentwood | £478,973 | 2.2% | 1.8% |
| Paddington | W2 | £999,725 | -12.0% | City of Westminster | £891,532 | -13.3% | 1.3% |
| Ilford | IG1 | £387,769 | 1.0% | Redbridge | £467,406 | -0.3% | 1.3% |
| Ealing Broadway | W5 | £628,631 | 5.0% | Ealing | £537,014 | 5.0% | 0.0% |
| Harold Wood | RM3 | £361,636 | 4.0% | Havering | £432,421 | 4.4% | -0.4% |
| Manor Park | E12 | £427,790 | -1.0% | Newham | £395,101 | -0.1% | -0.9% |
| Goodmayes/Seven Kings | IG3 | £470,069 | -2.0% | Redbridge | £467,406 | -0.3% | -1.7% |
| Slough/Burnham | SL1 | £341,619 | 2.0% | Slough | £316,970 | 3.8% | -1.8% |
| Abbey Wood | SE2 | £371,368 | 3.0% | Bexley | £403,089 | 5.0% | -2.0% |
| Langley | SL3 | £425,498 | 1.0% | Buckinghamshire | £469,040 | 3.1% | -2.1% |
| Stratford/Maryland | E15 | £465,442 | -3.0% | Newham | £395,101 | -0.1% | -2.9% |
| Tottenham Court Road | W1 | £1,677,972 | -1.0% | Camden | £895,595 | 2.1% | -3.1% |
| Reading | RG1 | £289,951 | 2.0% | Reading | £327,738 | 5.4% | -3.4% |
| Twyford | RG10 | £571,820 | 4.0% | Wokingham | £521,982 | 7.7% | -3.7% |
| Custom House | E16 | £438,201 | -4.0% | Newham | £395,101 | -0.1% | -3.9% |
| Woolwich | SE18 | £399,888 | 2.0% | Greenwich | £436,789 | 6.3% | -4.3% |
| Southall | UB2 | £404,506 | -1.0% | Ealing | £537,014 | 5.0% | -6.0% |
| Acton Main Line | W3 | £543,129 | -2.0% | Ealing | £537,014 | 5.0% | -7.0% |
| Gidea Park | RM2 | £477,960 | -4.0% | Havering | £432,421 | 4.4% | -8.4% |
| Whitechapel | E1 | £572,576 | -1.0% | Tower Hamlets | £510,543 | 10.0% | -11.0% |
| Canary Wharf | E14 | £559,294 | -17.0% | Tower Hamlets | £510,543 | 10.0% | -27.0% |
| Average | £540,283 | 2.4% | Average | £536,542 | 2.2% | 0.2% | |
| *Heathrow T2,3,4 & 5 excluded due to a lack of house price data for the TW6 postcode | |||||||
Postcode house price data sourced from PropertyData
Wider local authority house price data sourced from the Land Registry
Where more than one Crossrail station shares both the same postcode and local authority, they have been included as a single data point.
About the Author
Established in 1958, Benham and Reeves is one of London’s oldest, independently owned property lettings and sales agents. With specialism in residential sales, corporate lettings and property management in prime areas of London, the company operates from 21 prominently located branches and 11 international offices.View all posts by Benham & Reeves