- Selling
- Buying
- Landlords
- Renting
- New homes
- House prices
- International services
 International offices
China, Hong Kong SAR, India, Indonesia, Malaysia, Middle East, Qatar, Singapore, Thailand and Turkey
Learn more - News
- Contact
- About us
- My B&R


Home Press releasesProperty marketOlympic legacy is still benefiting the London property market in these Boroughs
Olympic legacy is still benefiting the London property market in these Boroughs
- Buying, Landlords & investors, Property market, Selling
- 19.07.21
- Benham & Reeves
This weekend will see the delayed Tokyo 2020 Olympic Games finally get underway, having been postponed last year due to the COVID-19 outbreak, along with pretty much everything else in life.
Much like the recent Euros, it promises to be a unique sporting event with restrictions continuing to prevent a full return to normality.
However, it could leave a far longer lasting legacy, at least where the property market is concerned. That’s if London is anything to go by according to the latest property market analysis by London lettings and sales estate agent, Benham and Reeves.
East London
However, many areas of London underwent extensive regeneration schemes prior to the games, with parts of Stratford in the borough of Newham, in particular, subject to a complete transformation.
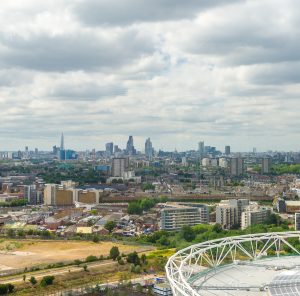
While there are many haunting images of abandoned Olympic venues from bygone games, London’s Olympic stadium is now the home of West Ham, while the Olympic village has been repurposed into much needed housing for London homebuyers and renters.
A total of six other boroughs played host to the Olympics, including Waltham Forest, Barking and Dagenham, Hackney, Greenwich and Tower Hamlets and their respective property markets seem to have benefited as a result.
In fact, house price growth across these six boroughs has averaged 6.9% per year since 2012, 1.3% more than London as a whole. They’ve also increased by a total of 78% on average, 17% more than the wider London average.
When looking at each borough individually, no less than three of them sit at the top of the table for house price growth when compared to every other London borough.
Waltham Forest takes the gold with house prices up 106% since the Olympics, averaging a 7.4% increase per year. House prices in Barking and Dagenham have climbed 86% since the summer of 2012, while in Newham they’ve increased by 81%, with both seeing a respective average annual rate of growth of 7.4% and 7.1%.
While Hackney (66%), Greenwich (66%) and Tower Hamlets (63%) haven’t benefitted to quite the same extent, all three have seen house prices increases at a greater rate than the wider average across the capital.
Director of Benham and Reeves, Marc von Grundherr, commented:
“The huge Olympic regeneration of London and Stratford, in particular, brought about a monumental boost to property prices and today, the London Borough of Newham remains one of the best performing pockets of the London market as a result.
This has no doubt had a knock-on impact to the neighbouring boroughs of Barking and Dagenham and Waltham Forest. So it’s hardly surprising that all three of these Olympic host boroughs sit top of the property price growth table when analysing the market since 2012.
It’s great to see that not only were the London games a great success for the GB team, but they’ve also left a lasting and positive legacy for the local housing markets and wider economies that were such an integral part of hosting them.”
| Category | Total Change in Property Values – Aug 2012 to May 2021 (%) | Average annual change – Aug 2012 to May 2021 (%) |
|---|---|---|
| Olympic host borough | 78% | 6.9% |
| London overall | 61% | 5.6% |
| Data sourced from the Gov.uk – UK House Price Index (August 2012 to May 2021 – latest available) | ||
| Location | Category | AveHP – August 2012 | AveHP – latest May 2021 | Total Change (%) | Average Annual Change (%) |
|---|---|---|---|---|---|
| Waltham Forest | Olympic host borough | £236,018 | £487,133 | 106% | 8.7% |
| Barking and Dagenham | Olympic host borough | £166,180 | £308,760 | 86% | 7.4% |
| Newham | Olympic host borough | £214,977 | £389,309 | 81% | 7.1% |
| Lewisham | London borough | £243,510 | £438,510 | 80% | 7.0% |
| Bexley | London borough | £205,197 | £368,555 | 80% | 6.9% |
| Havering | London borough | £221,084 | £388,851 | 76% | 6.7% |
| Croydon | London borough | £222,026 | £385,311 | 74% | 6.6% |
| Bromley | London borough | £286,912 | £485,947 | 69% | 6.3% |
| Enfield | London borough | £252,055 | £424,339 | 68% | 6.1% |
| Redbridge | London borough | £269,620 | £448,582 | 66% | 5.9% |
| Hackney | Olympic host borough | £333,002 | £553,032 | 66% | 6.2% |
| Merton | London borough | £326,136 | £541,504 | 66% | 6.1% |
| Greenwich | Olympic host borough | £241,372 | £400,216 | 66% | 6.1% |
| Sutton | London borough | £239,079 | £394,981 | 65% | 5.9% |
| Hillingdon | London borough | £262,453 | £432,718 | 65% | 5.9% |
| Tower Hamlets | Olympic host borough | £290,365 | £474,144 | 63% | 5.8% |
| Haringey | London borough | £347,970 | £563,687 | 62% | 5.7% |
| Hounslow | London borough | £273,858 | £442,023 | 61% | 5.6% |
| Lambeth | London borough | £338,402 | £542,973 | 60% | 5.6% |
| Southwark | London borough | £340,003 | £528,767 | 56% | 5.3% |
| City of London | London borough | £496,168 | £765,822 | 54% | 5.6% |
| Kingston upon Thames | London borough | £329,394 | £507,702 | 54% | 5.2% |
| Ealing | London borough | £330,626 | £508,907 | 54% | 5.1% |
| Richmond upon Thames | London borough | £470,964 | £723,775 | 54% | 5.1% |
| Harrow | London borough | £310,417 | £475,121 | 53% | 5.0% |
| Islington | London borough | £423,993 | £648,263 | 53% | 5.2% |
| Brent | London borough | £333,734 | £508,571 | 52% | 5.0% |
| Barnet | London borough | £362,586 | £546,082 | 51% | 4.8% |
| Wandsworth | London borough | £426,869 | £625,412 | 47% | 4.6% |
| Camden | London borough | £614,424 | £835,265 | 36% | 3.8% |
| Hammersmith and Fulham | London borough | £592,532 | £780,944 | 32% | 3.4% |
| Westminster | London borough | £739,683 | £974,523 | 32% | 3.4% |
| Kensington and Chelsea | London borough | £1,042,777 | £1,209,210 | 16% | 2.1% |
| LONDON | London overall | £310,043 | £497,948 | 61% | 5.6% |
| Data sourced from the Gov.uk – UK House Price Index (August 2012 to May 2021 – latest available) | |||||
About the Author
Established in 1958, Benham and Reeves is one of London’s oldest, independently owned property lettings and sales agents. With specialism in residential sales, corporate lettings and property management in prime areas of London, the company operates from 21 prominently located branches and 11 international offices.View all posts by Benham & Reeves